The Top 10 Baseball Cities Winning the Housing Game in 2026

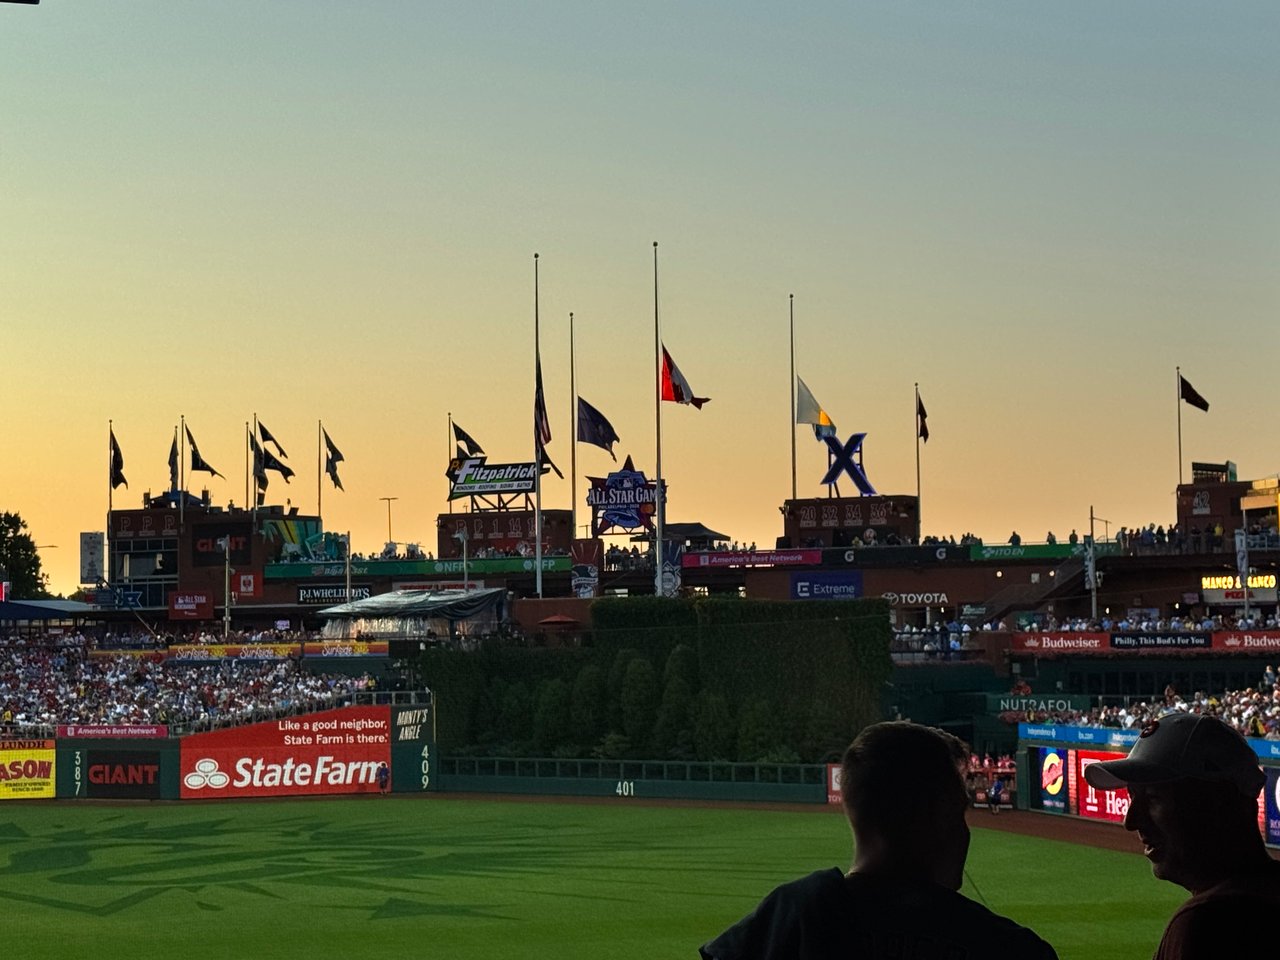
Baseball has always been a special part of our family’s life, and one of our favorite traditions is attending the MLB All-Star festivities each year. My husband and I love watching the best players in baseball come together for the Home Run Derby and the All-Star Game. The energy in the stadium, the excitement surrounding the events and the opportunity to see so many talented players in one place make it an unforgettable experience every year.
My favorite part, though, is seeing fans from cities across the country proudly show up to support their favorite players and teams. The jerseys, traditions and friendly rivalries are a reminder that baseball is about so much more than what happens on the field. It creates a sense of community and gives people another reason to feel connected to the city they call home.
That is why Zillow’s 2026 MLB Home Field Advantage Index caught my attention. In honor of MLB All-Star Week, Zillow ranked baseball markets based on a combination of performance on the field and conditions in the local housing market.
Baseball fans know there is nothing quite like cheering for the home team. But what if your favorite baseball city also offered an attractive place to put down roots?
The study evaluated five primary factors:
- The local team’s home-game winning percentage
- The estimated time it takes for buying to become more financially advantageous than renting
- The estimated number of years needed to save for a 20% down payment
- Interest from buyers located outside the metro area
- The level of engaged homebuyer demand in the market
Here are the top 10 baseball cities that Zillow says are winning both on the field and in the housing game.
1. Tampa Bay, Florida
Team: Tampa Bay Rays
Home winning percentage: 72.1%
Buy-versus-rent breakeven: 5.6 years
Estimated years to save: 8.6 years
Tampa Bay took the top spot by a significant margin. The Rays had the highest home winning percentage included in the study, while the metro also attracted considerable attention from buyers outside the area.
For people considering a move to Florida, Tampa Bay offers a combination of warm weather, professional sports, waterfront living and a housing market where purchasing may become financially beneficial within a relatively reasonable period.
2. Cleveland, Ohio
Team: Cleveland Guardians
Home winning percentage: 52.5%
Buy-versus-rent breakeven: 5.8 years
Estimated years to save: 6.8 years
Cleveland earned second place thanks largely to its relative affordability and active buyer market. Among the cities in the top 10, Cleveland has one of the shortest estimated timelines for saving enough money for a 20% down payment.
The city may appeal to buyers looking for established neighborhoods, access to major sports and entertainment, and home prices that can be more approachable than those in many larger metropolitan areas.
3. Milwaukee, Wisconsin
Team: Milwaukee Brewers
Home winning percentage: 61.4%
Buy-versus-rent breakeven: 5.8 years
Estimated years to save: 9.5 years
Milwaukee combines strong hometown baseball performance with favorable housing indicators. The city also received notable interest from people browsing listings from outside the metro area.
With its lakefront location, historic neighborhoods, food scene and strong sports culture, Milwaukee presents an appealing option for buyers who want big-city amenities without moving to one of the country’s most expensive markets.
4. Pittsburgh, Pennsylvania
Team: Pittsburgh Pirates
Home winning percentage: 51.1%
Buy-versus-rent breakeven: 7.9 years
Estimated years to save: 5.6 years
Pittsburgh stands out for having the shortest estimated down-payment savings timeline among the top 10 cities.
The metro is known for its distinctive neighborhoods, bridges, rivers and deep professional sports traditions. Its combination of character and comparatively accessible housing helped Pittsburgh secure the fourth position.
5. Atlanta, Georgia
Team: Atlanta Braves
Home winning percentage: 63.2%
Buy-versus-rent breakeven: 4.5 years
Estimated years to save: 7.8 years
Atlanta had one of the shortest buy-versus-rent breakeven periods in Zillow’s ranking. According to the study, buying may become more financially advantageous than renting after approximately 4.5 years, although every homeowner’s individual situation will be different.
The Atlanta area continues to attract buyers with its employment opportunities, diverse neighborhoods, growing suburbs and active entertainment and sports scene.
6. Detroit, Michigan
Team: Detroit Tigers
Home winning percentage: 52.3%
Buy-versus-rent breakeven: 4.3 years
Estimated years to save: 6.6 years
Detroit offers one of the most favorable buy-versus-rent timelines in the top 10. Its housing affordability, professional sports culture and variety of neighborhoods helped the metro earn the sixth position in Zillow’s ranking.
The Detroit area offers a wide range of housing options, from historic city neighborhoods to established suburban communities.
7. Phoenix, Arizona
Team: Arizona Diamondbacks
Home winning percentage: 59.5%
Buy-versus-rent breakeven: 4.8 years
Estimated years to save: 9.4 years
Phoenix landing in the top 10 is especially exciting for Arizona homeowners, buyers and baseball fans.
The Arizona Diamondbacks’ strong home performance helped Phoenix earn seventh place. The metro also had an estimated buy-versus-rent breakeven period of 4.8 years, one of the shortest timelines on the list.
Of course, “Phoenix” represents a large and incredibly diverse real estate market. Housing prices, property styles and lifestyles can vary substantially between areas such as Central Phoenix, North Phoenix, Desert Ridge, Scottsdale, Glendale, the West Valley and the Southeast Valley.
That variety gives buyers the opportunity to explore everything from low-maintenance condos and new-build communities to golf properties, family-friendly neighborhoods and luxury homes.
8. Philadelphia, Pennsylvania
Team: Philadelphia Phillies
Home winning percentage: 53.5%
Buy-versus-rent breakeven: 7.8 years
Estimated years to save: 8.1 years
Philadelphia pairs passionate sports culture with the history and conveniences of a major East Coast city.
Buyers can find a wide variety of property types throughout the metro, including downtown condos, traditional rowhomes, established suburban communities and larger homes outside the city center.
9. Cincinnati, Ohio
Team: Cincinnati Reds
Home winning percentage: 46.3%
Buy-versus-rent breakeven: 4.7 years
Estimated years to save: 7.2 years
Cincinnati’s favorable housing numbers helped it reach the top 10 despite a lower home winning percentage than several other teams on the list.
Its estimated 4.7-year buy-versus-rent breakeven period is among the shortest in Zillow’s study, making Cincinnati a market worth considering for buyers who want Midwestern affordability, established neighborhoods and access to professional sports.
10. Chicago, Illinois
Team: Chicago White Sox
Home winning percentage: 66.7%
Buy-versus-rent breakeven: 11.2 years
Estimated years to save: 7.4 years
Chicago rounds out the top 10, with the White Sox benefiting from a strong home winning percentage in Zillow’s dataset.
Chicago’s estimated breakeven period is longer than those of most other cities in the top 10. However, the metro’s architecture, neighborhoods, public transportation, cultural attractions and passionate sports community continue to attract local and relocating buyers.
What Buyers Should Take Away From the Rankings
These rankings are a fun way to compare baseball markets, but they should be viewed as a starting point rather than a formula for deciding where to purchase a home.
A metro-wide average cannot account for every neighborhood, household budget or buyer goal. The right decision will depend on factors such as:
- How long you plan to remain in the home
- Your available down payment
- Current mortgage rates
- Property taxes, insurance and maintenance expenses
- Your desired monthly payment
- Your lifestyle and preferred location
- The availability and price of homes that meet your needs
Even within the same metropolitan area, housing costs and market conditions can change significantly from one community to another.
Is Phoenix the Right Home Field for You?
Phoenix’s position at number seven highlights what many Arizona residents already appreciate: the Valley offers professional sports, year-round recreation, employment opportunities and a wide variety of communities and housing options.
Whether you are moving across the country, relocating within Arizona or simply wondering whether buying makes sense compared with continuing to rent, having a personalized strategy is essential.
I would be happy to help you compare neighborhoods, understand current Phoenix-area market conditions and create a home search based on your budget and goals.
Ready to explore your options in Phoenix or Scottsdale? Contact me to start the conversation.
Ashley Mullins
Jason Mitchell Group
480-418-8090
www.ashley-mullins.com
https://linktr.ee/ashleymullinsrealestate
Source and Methodology
Ranking information and statistics featured in this post were sourced from Zillow’s “Which Baseball Cities Are Winning in the Housing Game?” article and MLB Home Field Advantage Index.
View Zillow’s complete article, methodology and rankings
This article is provided for general informational and entertainment purposes. Housing conditions, affordability and mortgage scenarios vary by property and individual circumstances.